


The Great Inflation Debate
Will we see inflation, and how long will it last?


Our last Macro Update discussed Biden’s infrastructure plan and employment. This week’s newsletter takes a deeper dive into the inflation debate. Subscribe now to never miss an update.
The Last Decade:
Inflation concerns are on the rise after a meteoric expansion of the Fed’s balance sheet and anticipation of a red hot economy after the COVID-19 pandemic subsides. Accordingly, the 5-year breakeven inflation rate, which is a measure of expected inflation derived from 5-year treasuries, is at levels not seen since 2011, and the ten-year treasury yield is trading at ~1.5% after posting lows of just 0.5% back in August. So the key question on investors’ minds is “will we see inflation?” To frame the question today, let’s first try to understand why there wasn’t significant inflation over the last decade.
During the 2007-2008 financial crisis, the Federal Reserve’s balance sheet expanded significantly from $870 billion in August 2007 to $4.5 trillion in early 2015 as part of the Fed’s quantitative easing program to shore up financial markets. In simple terms, QE involves the central bank purchasing long-dated securities from member banks, thus boosting the money supply and lowering long-term interest rates, thus making it easier for banks to lend. Much like today, the expansion of the money supply put inflation concerns on the forefront of investors’ minds.
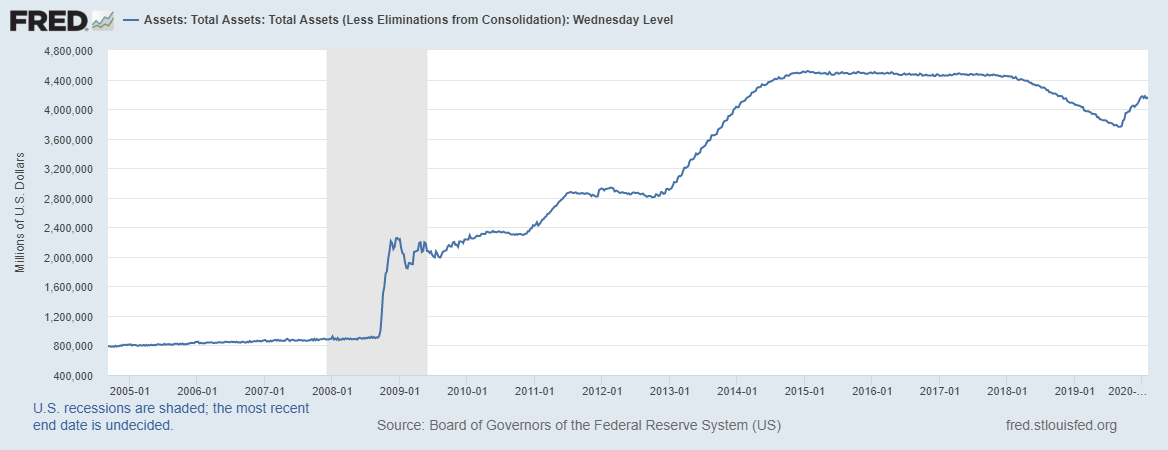
Source: Federal Reserve Economic Data
So, the Fed had just had its largest balance sheet expansion to date, the economy was recovering with the unemployment rate dropping from a high of 10% in October 2009 to just 3.5% in September 2019, but the average inflation rate from across that period was just 1.8%. So, why wasn’t there significant inflation?
The answer might be found in the velocity of money. Fisher’s quantity theory of money suggests that as with commodities, the value of money or the price level is determined by supply and demand, and the supply of money is the product of its quantity (M) and the and the number of times that money changes hands, known as its velocity (V).
The velocity of money is calculated by nominal GDP divided by M2 money stock. As seen in the chart below, the velocity contracted substantially as the Fed’s balance sheet expanded during the 2008-2009 financial crisis. Notably, velocity continued to contract despite a recovering economy, meaning that M2 money stock expanded faster than GDP. Why did this happen? Because banks kept much of that cash as excess reserves instead of lending it out, very little of that money actually got back into the real economy to boost GDP.
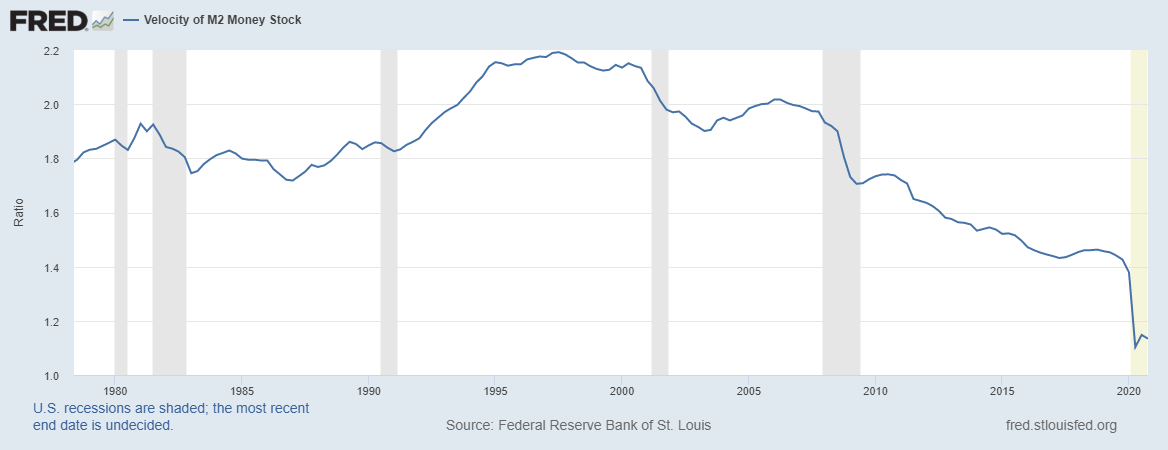
Source: Federal Reserve Economic Data
So what’s different this time?
In the wake of the COVID-19 pandemic, the Federal Reserve responded rapidly, with the unprecedented expansion of their balance sheet and quantity of money dwarfing that of the 2007-2008 financial crisis. Accordingly, M2 money stock, a measure of the money supply including cash, checking deposits and easily convertible near money, jumped by more than 25% from pre-COVID levels. So is anything different this time? And will we see inflation as a result?
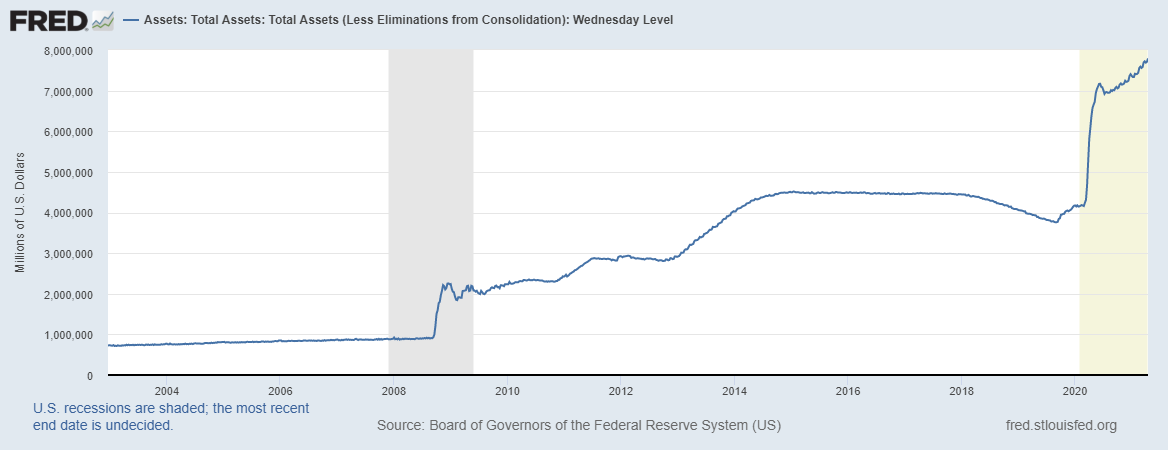
Source: Federal Reserve Economic Data
One of the key differences is that now the money created by the Fed is not being directed to bank reserves like in 2008. It’s going straight into consumer bank accounts via stimulus checks and grants, propelling household savings to record-levels. The U.S. consumer personal saving rate hit 33.7% in April 2020 and is currently sitting at 13.6%, higher than any pre-COVID level since 1975. U.S. consumers are sitting on piles of cash that will likely make its way into the real economy, particularly the retail sector, once it fully reopens.
The economic outlook post-COVID appears optimistic. The powerful combination of pent up demand for retail, travel and leisure, and record-levels of savings will likely propel growth forwards, with the IMF raising their global GDP growth estimates from 5.5% to 6% for 2021, with the U.S. economy anticipated to expand by 6.4%. What does this mean for inflation? In contrast with the last decade, the velocity of money might actually start to pick up, and if that happens, we could see higher levels of inflation.
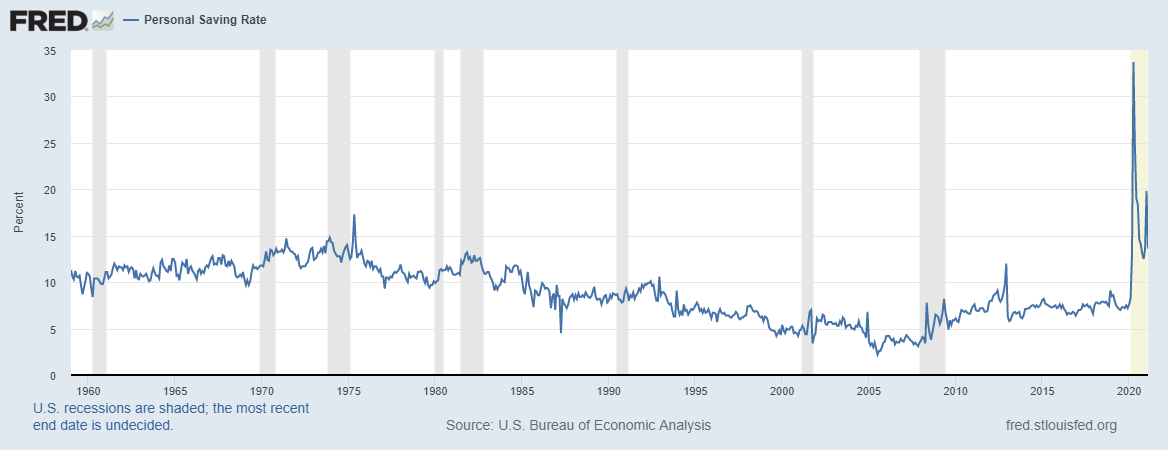
Source: Federal Reserve Economic Data
The Consumer Price Index:
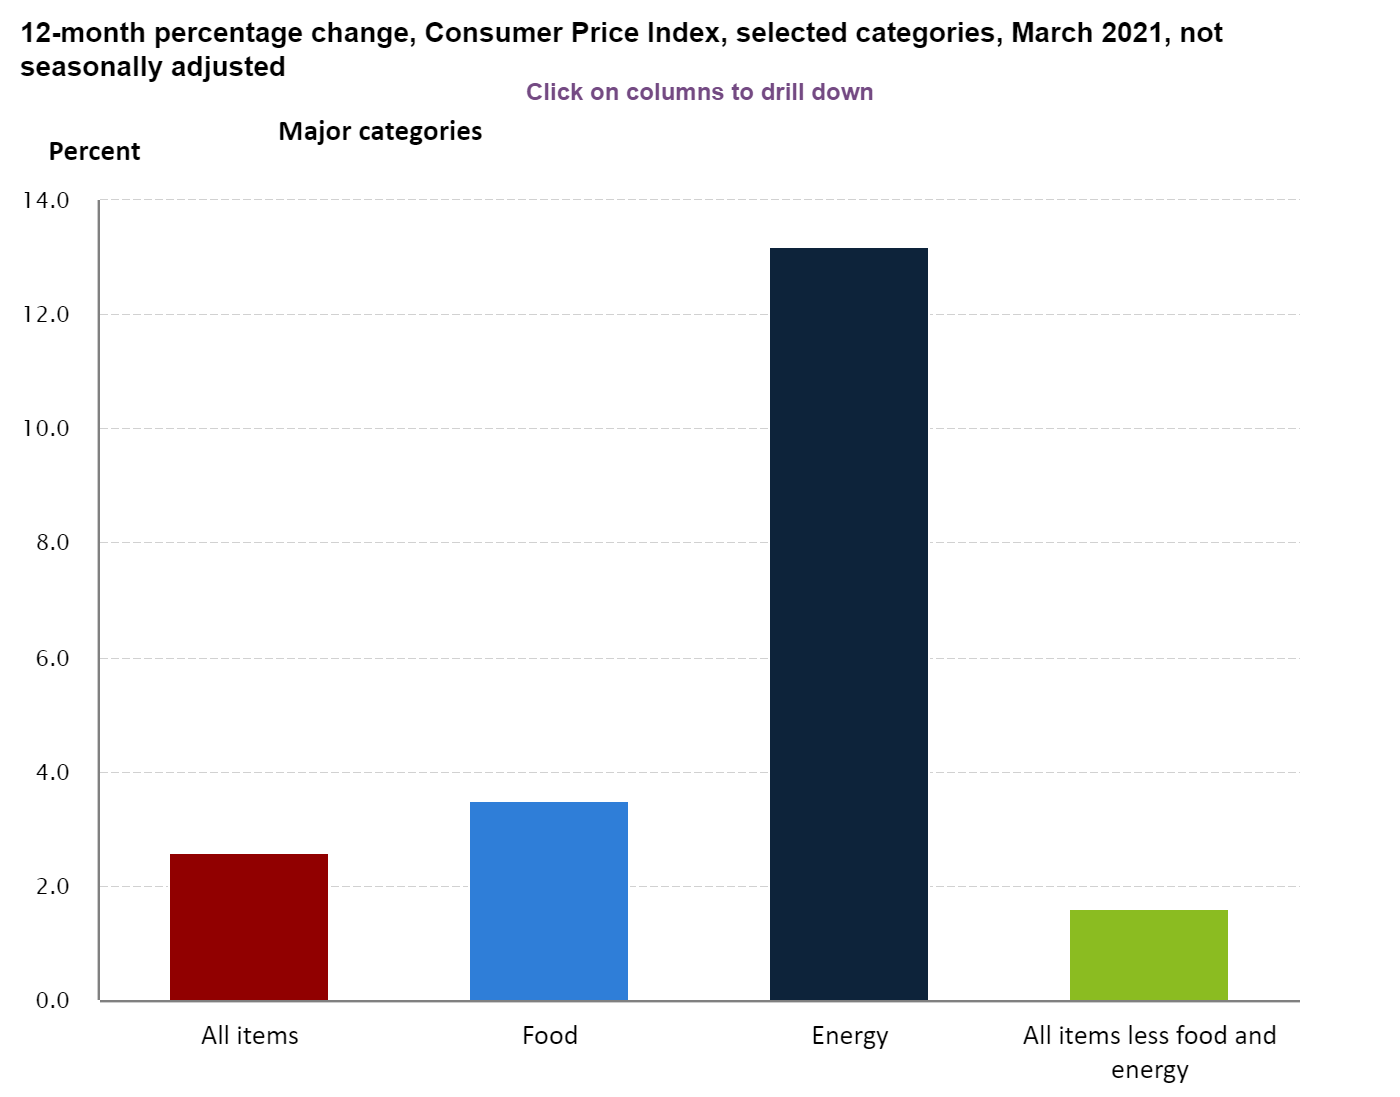
Source: Bureau of Labor Statistics
The latest CPI report presents a mixed picture of inflation at the minute. The headline figure of 2.6% YoY suggests that inflation is picking up at a rapid rate, with the monthly change of 0.6% the largest rise since August 2012, but this was heavily driven by the energy index which increased by 13.2% over the last 12 months. In the context of oil prices turning negative in April 2020 due to demand drying up, this isn’t particularly alarming. To further break down the report, the food index rose by 3.5% over the last 12 months, and the index for all items excluding food and energy rose by 1.3% over the same period.
According to a survey conducted by the Federal Reserve Bank of New York, consumers are already expecting higher home, gas and rent prices. The Fed has reiterated its view that the recent spike in the CPI is simply “transitory” and will wait for harder evidence of longer term inflation before stepping in, but this puts them at risk of falling behind the curve, and with business expecting a red-hot economic recovery driven by spending, this growth becomes self-fulfilling. Thus longer-term non-transitory inflation becomes much more likely.
Conclusions?
The expansion in the monetary base following the COVID-19 outbreak is different from the 2007-2008 financial crisis. For one, it’s much larger in scale, and this time the money isn’t just going into bank reserves - it’s going straight to consumer wallets. The perfect storm of:
Significant pent up demand
Consumers sitting on record-levels of cash
Evidence of existing pressure on producer prices feeding through to consumer prices
A central bank that might find itself behind the curve
… makes it increasingly likely that we’ll see higher inflationary pressure as the economy makes a roaring comeback. The question remains how long it will last.
Disclaimer: All material presented in this newsletter is not to be regarded as investment advice, but for general informational purposes only. You are solely responsible for making your own investment decisions. Owners of this newsletter, its representatives, its principals, its moderators, and its members, are NOT registered as securities broker-dealers or investment advisors either with the U.S. Securities and Exchange Commission or with any securities regulatory authority. By reading and using this newsletter or using our content on the web/server, you are indicating your consent and agreement to our disclaimer.
Yes we will continue to see a slight increase in a 'rotational venue of goods' ¤ varying from essentials to consumer to appliance to amenities; not only increase in price‰, but also increase per ¬yearly/quarter.. per standardized assessment of current product value to outcome value of obtaining/maintaining/dissolving said product, as these are grey areas that can vary per region. The inflation will never stop.. or at least not for the forgoing future in America, as we like everything big, including the number involved with our CandyBar purchases! Twix for $100?... Gimme a break!